Thursday January 05, 2012

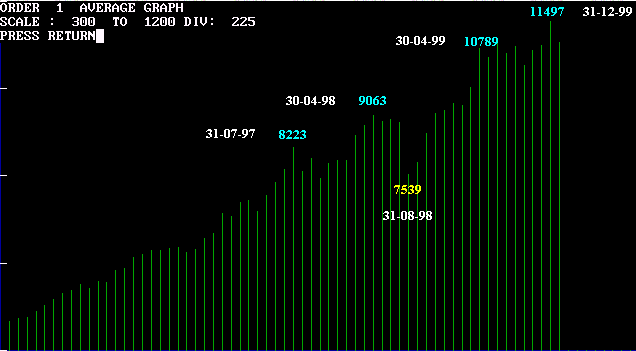
DJIA Monthly Chart (Dow Jones Industrial Average)
Fibonacci Series = (11497 / 7539) = 9985 / 9518 / 9051
For detailed analysis, see DJIA frequency and probability chart and home page for current comment.
Albert Cheung (Ph.D.) E-mail : qindex@hotmail.com
DJIA Weekly Chart DJIA Daily Chart
Mirror Sites
Quantum Index works with a third party that serves ads to this site.


